|
| ||||
| HV Power Application Newsletter #15 (April 2015) | ||||
|
|
||||
|
It’s not just about the products! While we do pride ourselves in the technology HV Power offers being sound, reliable and robust, it’s not just about the product specifications or the price! You need competent, responsive and reliable support. At HV Power we strive for our staff to add-value to the products/services you purchase. We are hands-on technologists and certainly not simply box movers. Our experience of ‘sweating the small but critical stuff’ such as managing firmware versions, software releases and the development of standardised product implementations has proven to be really important for our customers’. In this and following newsletters, we are taking some space to highlight the staff who make this happen at HV Power! Critical asset condition monitoring The term Condition Monitoring conjures up a myriad of possibilities, each with a different meaning and emphasis from one utility to the next. As with most aspects of ‘health monitoring’, there are so many variables that can be key indicators, and so many prevailing conditions, that it can be confusing. Periodic DGA analysis is a long established industry standard for oil filled devices, in determining baselines, identifying trends as assets age and detection of developing faults within the device. The fact that the standard usually requires two samples to be taken to eliminate contamination errors and the nature of some of the gases being sampled requiring appropriate handling procedures, this manual sampling process is anything but fool-proof. This has led to a number of on-line analyser products being developed that provide real time indications of evolving fault conditions within oil filled devices, and reduce process errors. These monitoring devices are particularly relevant to power transformers, which are often the key critical component in the network. Interestingly, the use of permanently installed on-line moisture and DGA devices does not eliminate the manual sampling and laboratory analysis. The two approaches are seen to complement each other rather than one replacing the other. To this end, HV Power is pleased to announce that we have added the MTE Hydrocal on-line moisture and gas in oil monitoring devices to our product portfolio. More details on this are available below. |
||||
| Power Quality: Automating the Analysis of customer voltage investigations to your network standard | ||||
|
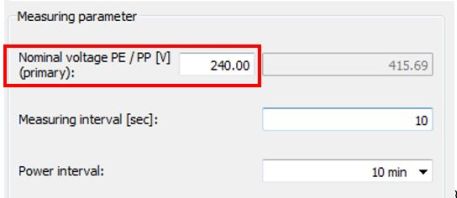
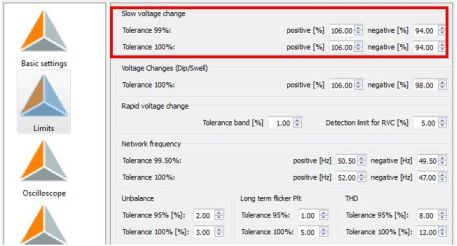
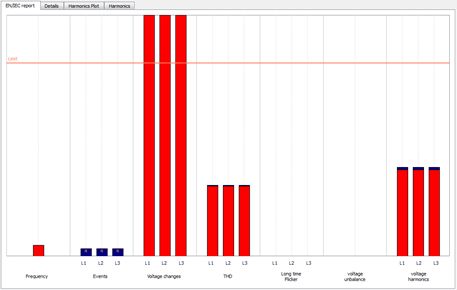
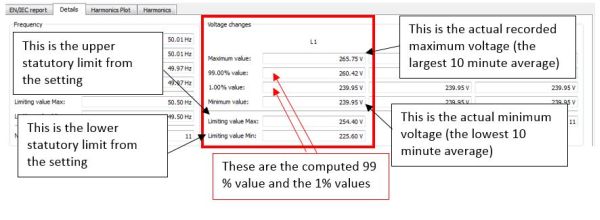
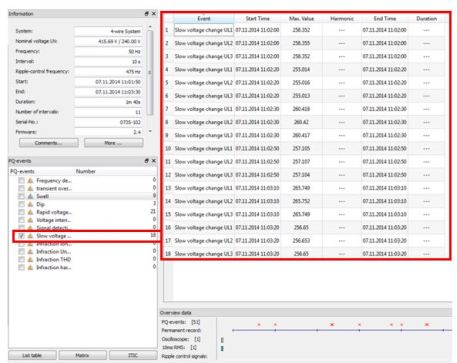
During a customer’s trial of the PQ-Box 100 and the WinPQ Mobile software, we asked about the common customer voltage complaint investigations they were performing with their existing loggers. It appears that a number of their evaluations involved a process of manually “eyeballing” the measurement logs/data– that is, the voltage trace/ graph was displayed with a limit line set up on the screen and the data scrolled to see where the graph exceeded the limit. While WinPQ mobil certainly supports this manual method, it does offer much more powerful and automated evaluation based on EN 50160 style criteria. The flexibility in the PQ-Box 100 that suits many Australian and NZ users is that the evaluation limits can be setup by the user to match those used by each utility – it’s our observation that there appears to be little standardisation in following the actual PQ standards. Example Customer Criteria: Here, simply the statistical limits were altered from 5 and 95 % to 1 & 99 % (Figure 1). The Statutory Limit was entered as the target nominal voltage (Figure 2). Finally the evaluation criteria of 6 % was entered (Figure 3). Figure 4 shows the EN/IEC report summary, this provides a high level overview. This normalised graph provides a view of the data in relation to the upper limits. The red bar portion is the 99 % value, the blue is the 1 % value. Simply, if the bar graph exceeds the horizontal limit line, then one of the limits has been exceeded. This EN/IEC report summary is normally the first step, to get an overview of power quality. The actual values are shown in Figure 5. It can quickly been seen if the voltage exceeds the limits, and by what amount. In this example, corrective action was required as the 99 percentile value (260.42 V) exceeds the limit (254.4 V) Second customer evaluation: Here two methods were proposed. One was similar to their existing manual eyeball method, the second more rigorously following the use of measuring intervals. The Swell trigger was set to 6 % (Also shown in Figure 3). The table of all swell events was sorted according to duration, to determine if swells exceed 10 minutes in duration. While the swell reports the exact duration, the event is not synchronised to a 10 minute interval as referred in the evaluation criteria, so the second method was also proposed. The second method used the “Slow voltage event”, which is strictly evaluated over the 10 minute measuring interval. If the voltage exceeds the limit for the full 10 minute period, then an event is generated in that log. At the end of the measurement the log count automatically provides the count of the number of events. The actual log can be reviewed to determine if the events are consecutive or regular in occurrence (Figure 6). The team at HV Power will be pleased to help you understand where the automated evaluation criteria of the PQ-Box 100 can be put to use in your network for customer voltage complaint evaluations. |
||||
Voltage Regulator – HV Power’s Guides to REG-D & REG-DA |
||||
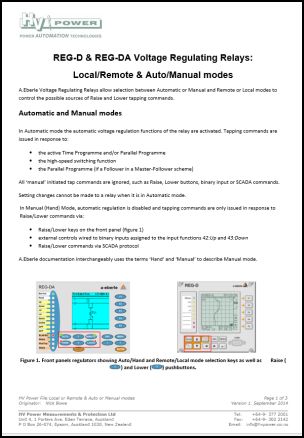
The HV Power website Technical Library contains documentation to support the REG-D and REG-DA Voltage Regulating Relays, we have recently released another Guide document. This one covers Local/Remote & Auto/Manual modes, and describes the interaction of these functions. Click here to access these guides and other useful support documentation.
|
|
Staff Feature: Rob Knight, Services Manager | ||
|
||||
Transformer Condition Monitoring: MTE - HYDROCAL |
||||
Transformers are the single most cost intensive and critical asset in power transmission/distribution and should therefore be supervised with special care. Analysis of the gases dissolved in transformer oil is recognised as the most useful tool for early detection and diagnosis of incipient faults in transformers. The cost effectiveness of online dissolved gas analysis (DGA) is well known in NZ and Australia, HV Power now support MTE’s range of, maintenance-free, online DGA and moisture in oil detection solutions branded HYDROCAL. Based in Switzerland, MTE (Meter Test Equipment) is perhaps better known for their highly dependable and highly accurate range of electricity revenue meter test equipment. Originally, the meter test equipment business was part of Landis&Gyr which was founded in 1896. In 1996 the meter test equipment was sold to MTE, who introduced their HYDROCAL range in 2006. HV Power only distribute MTE’s HYDROCAL branded range and do not represent their metering products. 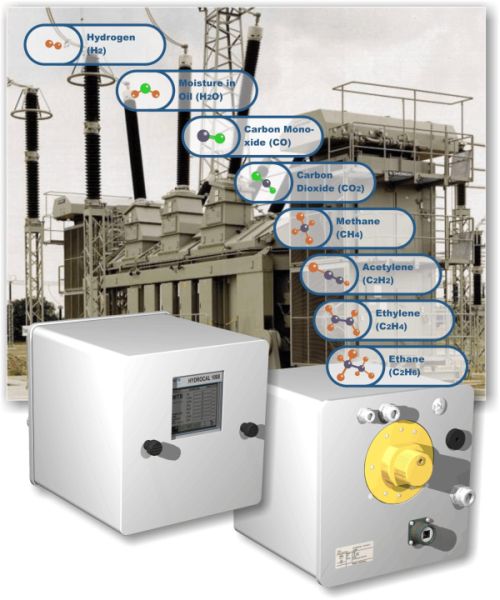
MTE 1008 HYDROCAL DGA. HYDROCAL capabilities range from the Model 1001+ that offers composite 6 gas sensing (& moisture in oil) capability to the 1008 multi-gas-in-oil analysis system with individual measurement of Moisture in Oil (H2O) and the key gases Hydrogen (H2), Carbon Monoxide (CO), Carbon Dioxide (CO2), Methane (CH4), Acetylene (C2H2), Ethylene (C2H4) and Ethane (C2H6).
| ||||
| SERVICES: Double Point, Status Inputs to REG-D/DA | ||||
|
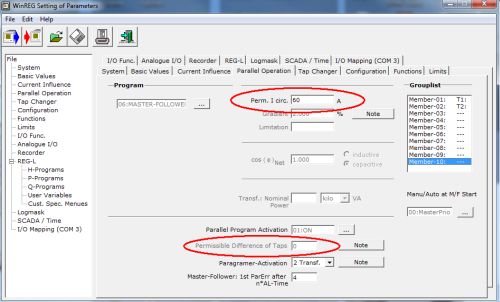
The Paragramer feature of the REG-D/DA uses the status of various switching devices associated with each transformer to automatically determine the parallel status of every transformer in a parallel control scheme: 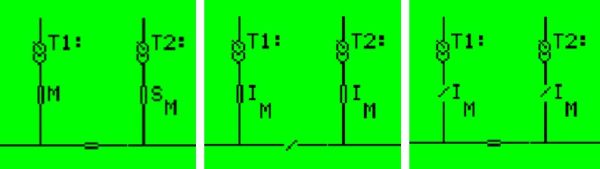 Circuit breaker and bus section display which control parallel programme activation. Some common examples of the status inputs used include the circuit breaker (PG:CB) and the bus section (PG_SC1), as shown above. These inputs are commonly brought into the REG-D/DA as a single-point logic signal, often at 110 Vdc. But what happens when one of these signals fails (for example, if a rodent chews through the cable, or a loose connection develops in the input circuit)? Besides a dead rat (hopefully) in perhaps 90 % of applications, 0 V on the status input represents an open breaker or open bus section. The REG-D/DAs will detect this as being that the transformers are now in Independent Mode, when in fact they are still connected to the same bus. Slight variations in the measured bus voltage can then cause the REG-D/DA’s to begin working/regulating against each other and tapping apart to control the bus voltage. A misconception amongst some users is that the REG-D/DAs in such a situation will ultimately lock out, because either the circulating current has become excessive, or because the Permissible Difference of Taps limit has been violated. However, both of these checks are only active for transformers in parallel, because independent transformers must be free to operate independently. The result is that although the bus voltage remains in the bandwidth, the actual circulating current can become dangerously large as the transformers tap further and further apart.
Fortunately, A.Eberle has a simple solution to this issue: double point inputs. By connecting both a N/O and a N/C contact to the REG-D/DA from each status input, and inverting one of them, the REG-D/DA will automatically use both of the contacts to determine the status of the bus status input. Only the ‘01’ and ‘10’ states are considered valid. If an ‘00’ or ‘11’ error states occur:
|
||||
| In Australia call 1-800 172 120 | www.hvpower.com.au ABN: 62 113 118 536 | |||
|
Copyright 2015 HV Power Measurements and Protection Limited. | ||||